Occupancy Grid Maps
Published:
Occupancy grid maps are a type of representation of an environment, and is commonly used by mobile robots for tasks such as path planning, localization, tracking, and many more. This article is an introduction to occupancy grid maps.
Introduction
Occupancy grid maps are used to represent a robot workspace as a discrete grid. They can be thought of as an architectural floorplan, which store an image-based representation of occupied and unoccupied space in an area. Occupied space can include walls and objects in the environment, while unoccupied space are areas the robot can move through, such as walkways.
The process of mapping such an environment involves probabilistic algorithms for mobile robots, which generally compute approximate posterior estimates for each obstacle in the environment. Both 2D and 3D occupancy grid maps can be generated.
Some examples of sensors used in collecting data for mapping can be:
- Monocular Cameras
- Stereo Cameras
- RGB-D Camera
- LiDAR / Laser Scanners / Laser Range Finders
- Sonar Range Sensor
Generating an Occupancy Grid Map
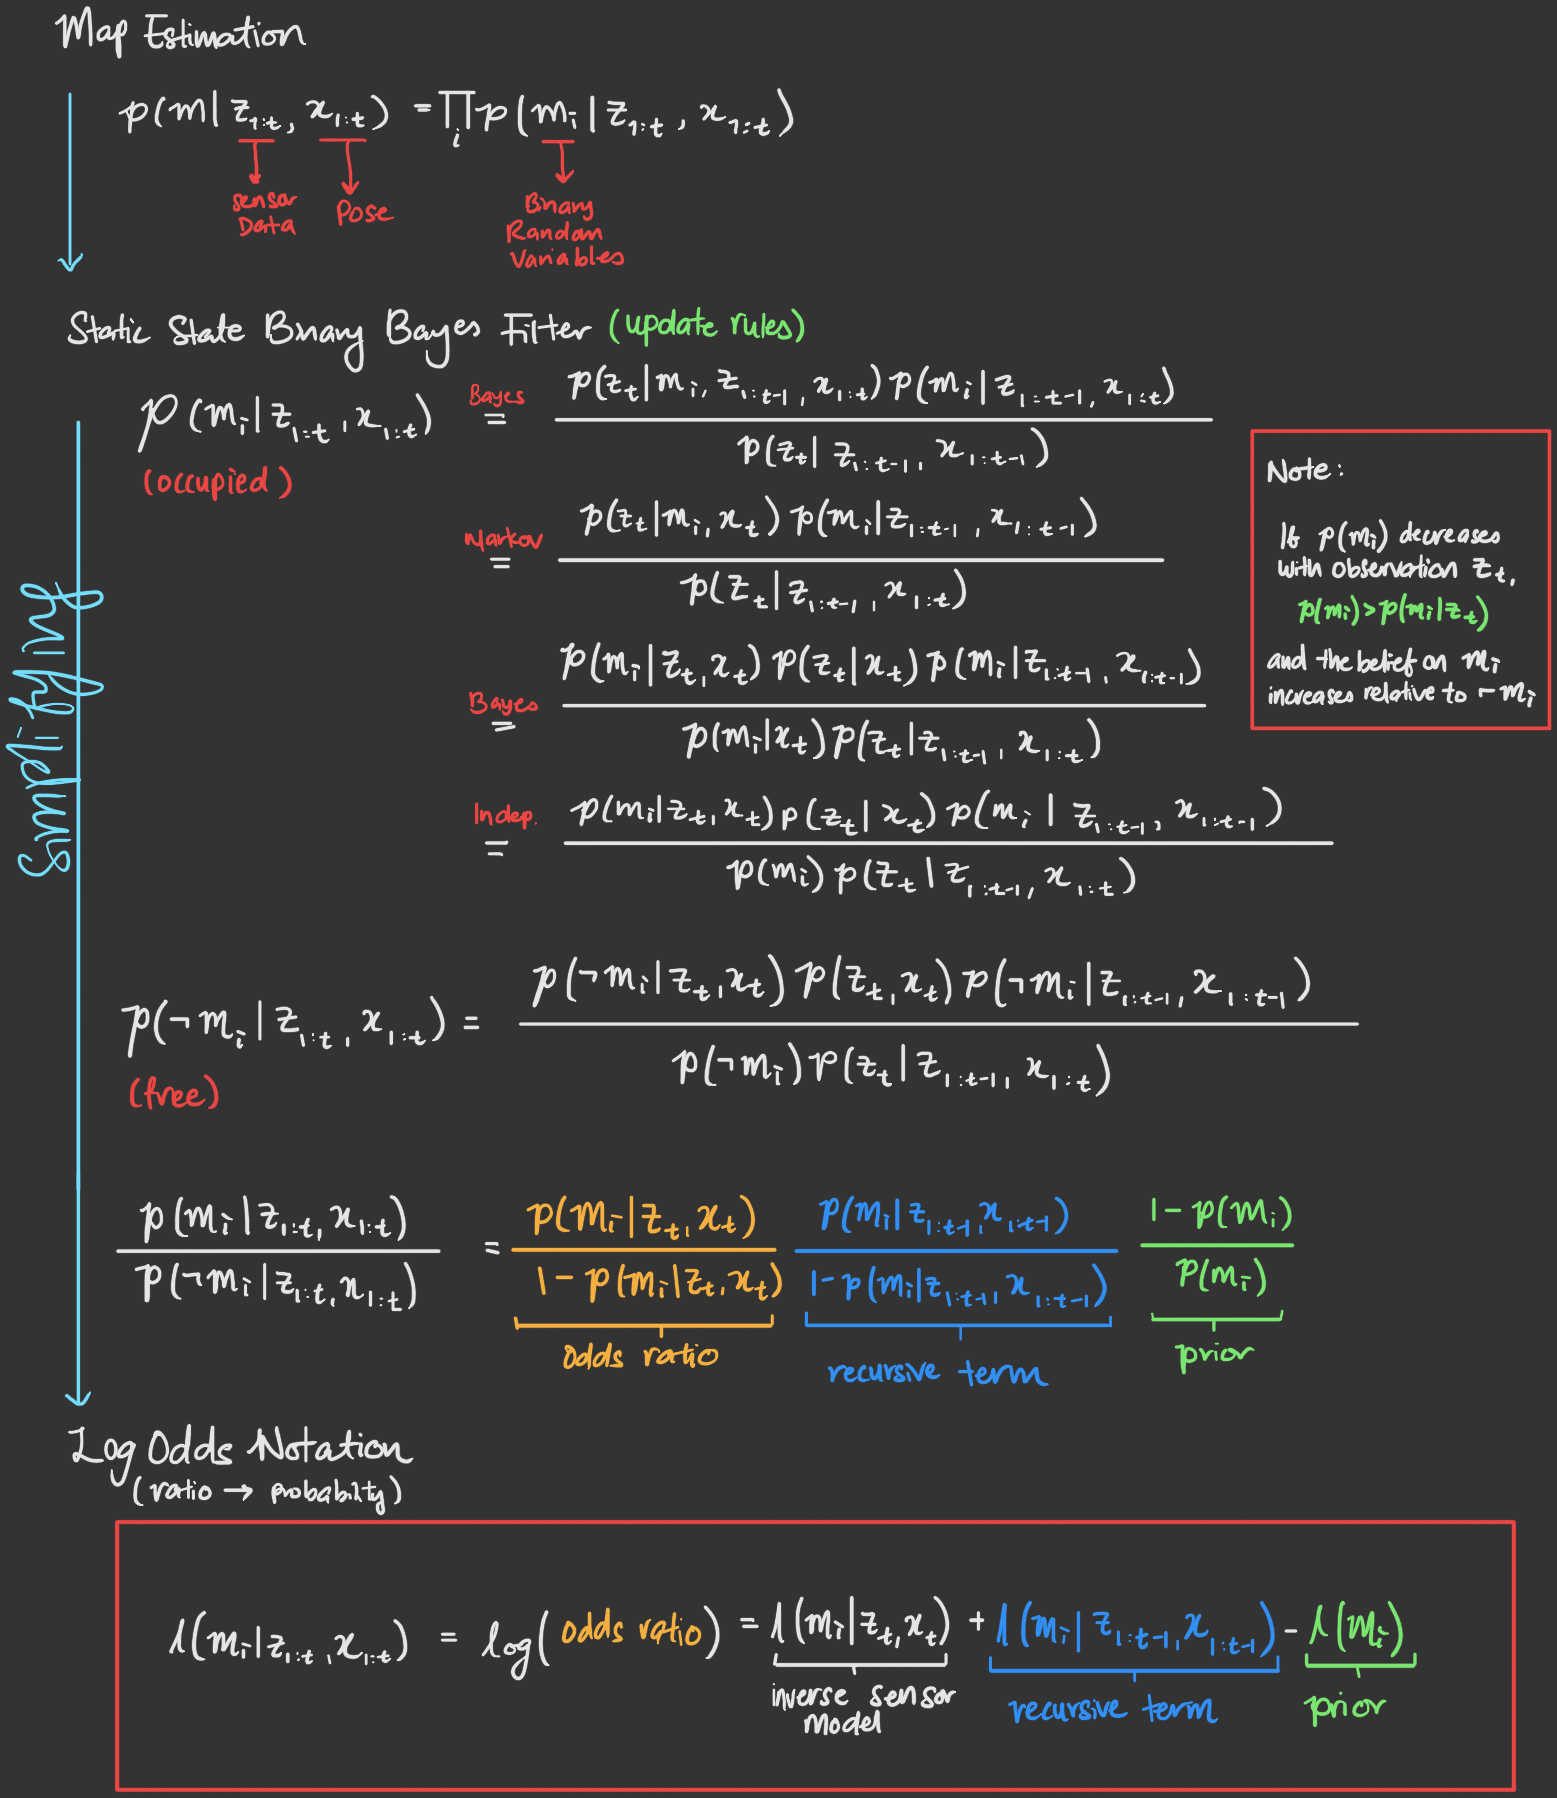
Algorithms to generate occupancy grid maps are filtering problems that receive noisy, uncertain sensor measurement data, with the assumption that the robot pose is known. This is the opposite of a localization problem.
Mathematically, an occupancy grid map follows a probabilistic algorithm, formulated as:

In an algorithmic form, it may be implemented as the following pseudo code:
occupancy_grid_mapping(l_t-1, x, z):
    for m in cells:
        if m in perceptual field of z:
            l_t = l_t-1 + inv_sensor_model(m, x, z) - l_0    # cell update
        else
            l_t = l_t-1
    return l_t
Inverse Sensor Model: Specifies a distribution over a binary state variable as a function of the measurement zt.
Binary Occupancy Grid Maps (2D)
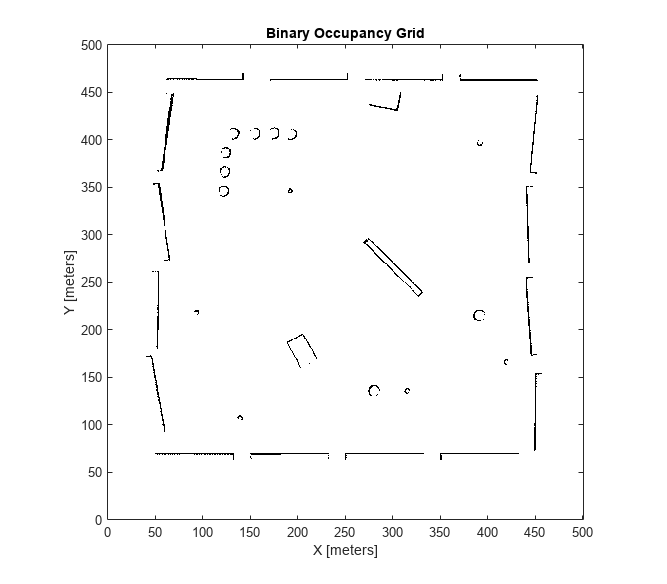
A binary occupancy grid uses true and false values to represent occupied and free spaces respectively. The map assumes every area corresponding to a cell is either completely free or occupied. The grid shows where obstacles are in the environment, and whether the robot can navigate through it. Binary grid maps are used when memory constraints are a concern.
In general, binary representations will follow:
- Black: Occupied (p(mi) = 1)
- White: Free (p(mi) = 0)
- Grey: Unknown (p(mi) = 0.5)
This model also assumes that the world is static (most mapping systems make this assumption) and each cell is independent of each other.
 Sample Binary Occupancy Grid Map (source: MATLAB)
Probability Occupancy Grid Maps (2D)
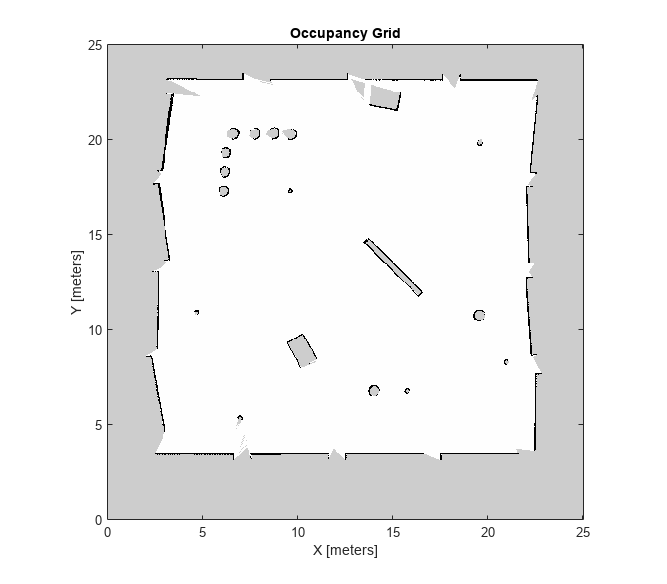
Probability occupancy grids uses probability values to generate a more detailed map than binary representations. This is usually the preferred method for using occupancy grids and is commonly referred to as simply an occupancy grid. Instead of binary 0 and 1 values, probabilistic occupancy grid maps have cells represented by a probability score of how likely that cell contains an obstacle. Probabilistic values can give better fidelity of objects in the space.
 Sample Occupancy Grid Map (source: MATLAB)
3D Occupancy Grid Maps
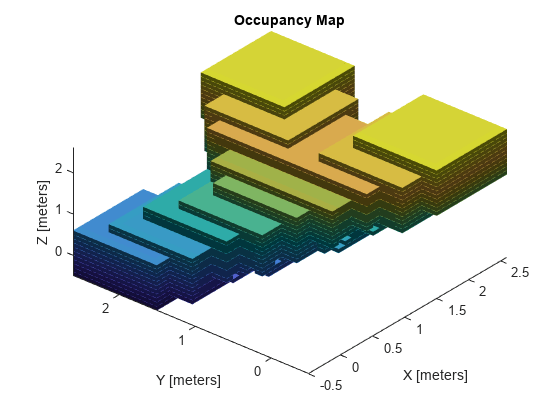
The grid map cells in a 3D representation are voxels, and map information is stored as probabilistic values in an octree data structure. Similarly, these probability values represent the occupancy of locations in the environment.
 Sample 3D Occupancy Grid Map (source: MATLAB)
Octree Data Structure: A hierarchical tree structure used for recursive subdivision of an environment into 8 cubic volumes (children), known as voxels, until it reaches a desired resolution (voxel size). Each node stores the probability values for locations in the map. There are point-region (PR) octrees and matrix-based (MX) octrees.
